


![]()
![]()
![]()
![]()
![]()


March/April 2024

January/February 2024


[PDF]
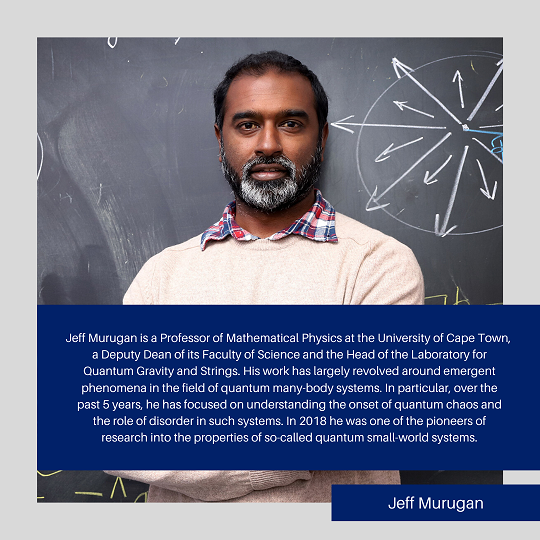
Jeff Murugan
Laboratory for Quantum Gravity & Strings, Department of Mathematics & Applied Mathematics, University of Cape Town, Cape Town, South Africa
Amanda Weltman
High Energy Physics, Cosmology & Astrophysics Theory Group, Department of Mathematics & Applied Mathematics, University of Cape Town, Cape Town, South Africa
Global pandemics
As we write this, the world is in the midst of a pandemic, the worst of at least 100 years, and the first in the era of widespread social connectivity. Humanity has certainly overcome pandemics before. The Black Plague, for example, decimated a significant proportion of the world’s population, and the Spanish flu pandemic of 1918 – our first encounter with the H1N1 virus – killed more than 40 million people worldwide over a period of just under a year, yet epidemiologists the world over are bracing for the next “big one” and wondering if the world can survive it. But why? Surely today we are far more aware of how viruses spread, of the role that hygiene plays in their containment, of how to sequence viral RNA and produce vaccines or antiviral drugs in record time? Well, it turns out that with the leaps in technology that have come since the Third Industrial Revolution, we now live in a world that is more connected than ever before and with this global connectivity comes an unprecedented risk of global spread of disease. As the world scrambles to contain outbreaks like Ebola in 2014, or Covid-19 in 2020, the role of doctors, virologists, and even politicians are intuitively obvious. But what could mathematicians, or more precisely applied mathematicians, possibly contribute to this calculus? In a word: Modelling.
Role of mathematics
Applied mathematicians – an umbrella term that we will use to mean mathematicians, applied mathematicians and physicists – love modelling things. From cosmic dynamics, to weather patterns, to the functioning of the human brain, mathematics is, to paraphrase Eugene Wigner, unreasonably effective in describing natural phenomena. Not only do these mathematical models have wonderful explanatory power, in many cases, they also exhibit remarkable predictive power! So why is it that, for all our technological advances, the human race has never been in such a precarious position when it comes to pandemic exposure.
Networks
By now, most of us have had the experience of being at some relatively far-off location and bumping into a complete stranger, only to find out that they are from the same town as you and know many of the same people as you. Such encounters are usually punctuated by an exclamation of “What a small world!”, or some variant thereof. In the 1970s, Harvard psychologist Stanley Milgrom, building on earlier work by social scientist Ithiel de Sola Pool and mathematician Manfred Kochen, conducted a groundbreaking experiment in social network theory to quantify this small-world phenomenon and found that any two individuals in the USA, in the 1970s mind you, were ‘connected’ to each other by six degrees of separation on average. In order to model this phenomenon, applied mathematician Steven Strogatz and his then PhD student Duncan Watts hit upon the idea of using an arcane branch of mathematics called graph theory to quantify the mechanics of such world networks [1].
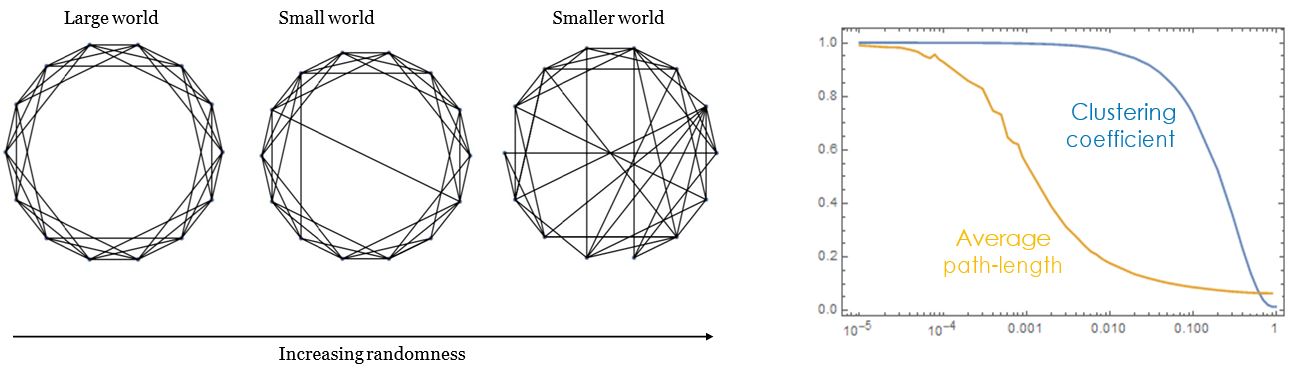
Figure 1: Network diagrams and a plot of the average path-length and clustering coefficients in small-world networks as a function of re-wiring connection probability. Note how rapidly the average path-length of the network decreases with increasing small-worldness.
In this picture, each individual in the social network is represented by a dot and the connection between two individuals by a line joining two dots. On one end of the spectrum of connected networks is a highly ordered nearest (or next-to-nearest) neighbour network in which each individual interacts with just their nearest or next-to-nearest etc. neighbour. This is an example of a large world, in the sense that the average path length of the network is large. The network is calculated by counting the number of pair-wise connections between all pairs of nodes in the network and taking the average. The large number of triangles that can be seen in this network means that the interactions are limited to neighbourhoods (suburbs, metropoles or countries) and have large clustering coefficients. At the other end of the spectrum is a random network where two nodes in the graph interact randomly. As one might expect, the diameter of a random network is much smaller than a regular network. The real world is somewhere in-between, with individuals primarily interacting within neighbourhoods but with some having the ability to interact across the whole network through, for example, international travel. Remarkably, as Watts and Strogatz discovered, in a small-world social network with a very large number of individual members, it takes a tiny fraction of the whole population with long-range interactions to be able to spread a viral infection across the small world. (Technically, if the population size is of order N, where N»1 is a very large number, then the number of individuals capable of communicating across the network need only be of order 1.)
Hubs
Steeped as we are today in social media, this all might seem quite obvious. So, what do we gain from this knowledge? Because what makes the network small-world is its topology (or shape), one might imagine that changing this shape by, for example, removing highly connected individuals (so-called hubs) one might convert a small-world network into a large-world one. This intuition is correct, but the applied mathematics of networks tells us precisely how. It also tells us the impact of altering the network by adding or deleting connections. As a ‘real-life’ example, consider the spread of the novel coronavirus Covid-19 that emanated in Wuhan, China. In trying to arrest the spread of the virus, one might ask what the most efficient strategy is? Cancelling flights? Shutting down airports? Banning travel altogether? A network analysis based on, say, a network of airports connected by the flights between them reveals that modifying the network by deleting edges (cancelling particular flights in and out of Wuhan) increases the diameter of the graph by only a small
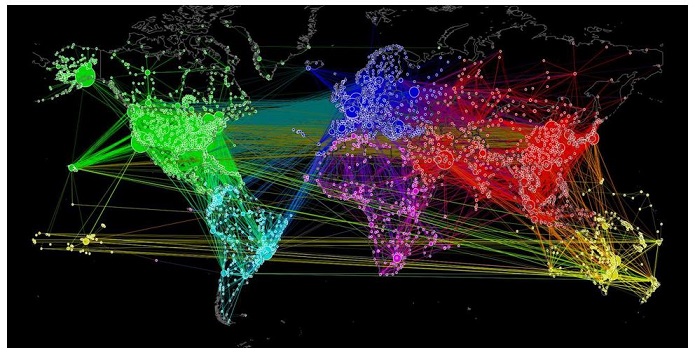
Figure 2: A network visualisation of global air traffic. The hub-and-spoke nature of flight routes point to a small-world structure of the network.
factor, at best delaying the spread by a few days. Deleting the Wuhan hub (by cancelling all paths in and out of Wuhan), on the other hand, has a far more significant impact on the diameter of the graph but, because it is not a node that is as connected as, say, Heathrow or Dubai, even this has only a limited effect in containing the viral spread. All these qualitative conclusions can and were supported by quantitative computer models based on recent data.
Effective strategies
The key point, however, is that knowing what doesn’t work allows governmental agencies to better formulate containment strategies that do. Instead of travel bans, for example, perhaps educating the population about proper hygiene would be a more efficient use of resources. This is the route taken by South Korea, with dramatic effects (relative to other countries that saw similar surges in Covid-19 infections at the same time)[2]. The most effective strategies require communal effort and cooperation, as well as effective communication, such as a mobile phone based amber alert system to inform people when someone tests positive in their area. The avoidance of Day Zero in Cape Town has already shown how effectively South Africans can avert disaster when they work together and cooperate. The scale of the problem is different, but the same can be true here; if we work together and if government response is swift and open, we can slow the progression of the virus, delay and dampen its peak, and thus also dampen it, so that it is within the manageable range for our health services. The first step is a widespread education campaign informing the public of what to look out for, and how to reduce and delay the spread; regular handwashing with soap, social distancing as far as possible and remaining at home when showing any symptoms as far as possible. In a catch-phrase, we all – doctors, politicians, scientists, citizens – need to do whatever it takes to flatten the curve of the number of infection cases over time [3].
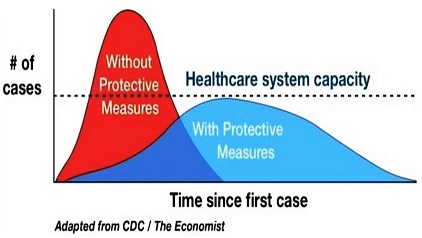
Source: www.flattenthecurve.com
Figure 3: Successful arrest of the spread of the Covid-19 virus will depend on whether we can flatten the curve.
Acknowledgements
We thank David Erwin, Jean-Gabriel Hartmann and Jonathan Shock for useful discussions on related work. We are especially grateful to Jean-Gabriel Hartmann for generating the network diagrams.
References
[1] Watts DJ, Strogatz SH. Collective dynamics of ‘small-world’ networks. Nature. 1998;393:440–442. https://doi.org/10.1038/30918
[2] Dong E, Du H, Gardner L. An interactive web-based dashboard to track COVID-19 in real time. Lancet Infect Dis. 2020. https://doi.org/10.1016/S1473-3099(20)30120-1
[3] McMurry J. Coronavirus (COVID-19): Update and thorough guidance [updated 2020 Mar 11]. Available from: www.flattenthecurve.com
![]()
![]()
![]()
![]()
![]()
March/April 2024
January/February 2024